black and brown leather padded tub sofa

Business Intelligence Tools

Unlock the potential of BI tools Power BI, SSRS, and Tableau with our expert insights.

Rated 5 stars by users

★★★★★

Empowering Your Business Intelligence Journey

At bi-app, we simplify business intelligence tools like SSRS, SSIS, and Power BI to help you make informed decisions and enhance your data-driven strategies.

150+

15

Trusted by Experts

Join Us

Business Intelligence Tools

Explore various business intelligence tools to enhance your data analysis and reporting capabilities effectively.

Data Visualization Tools

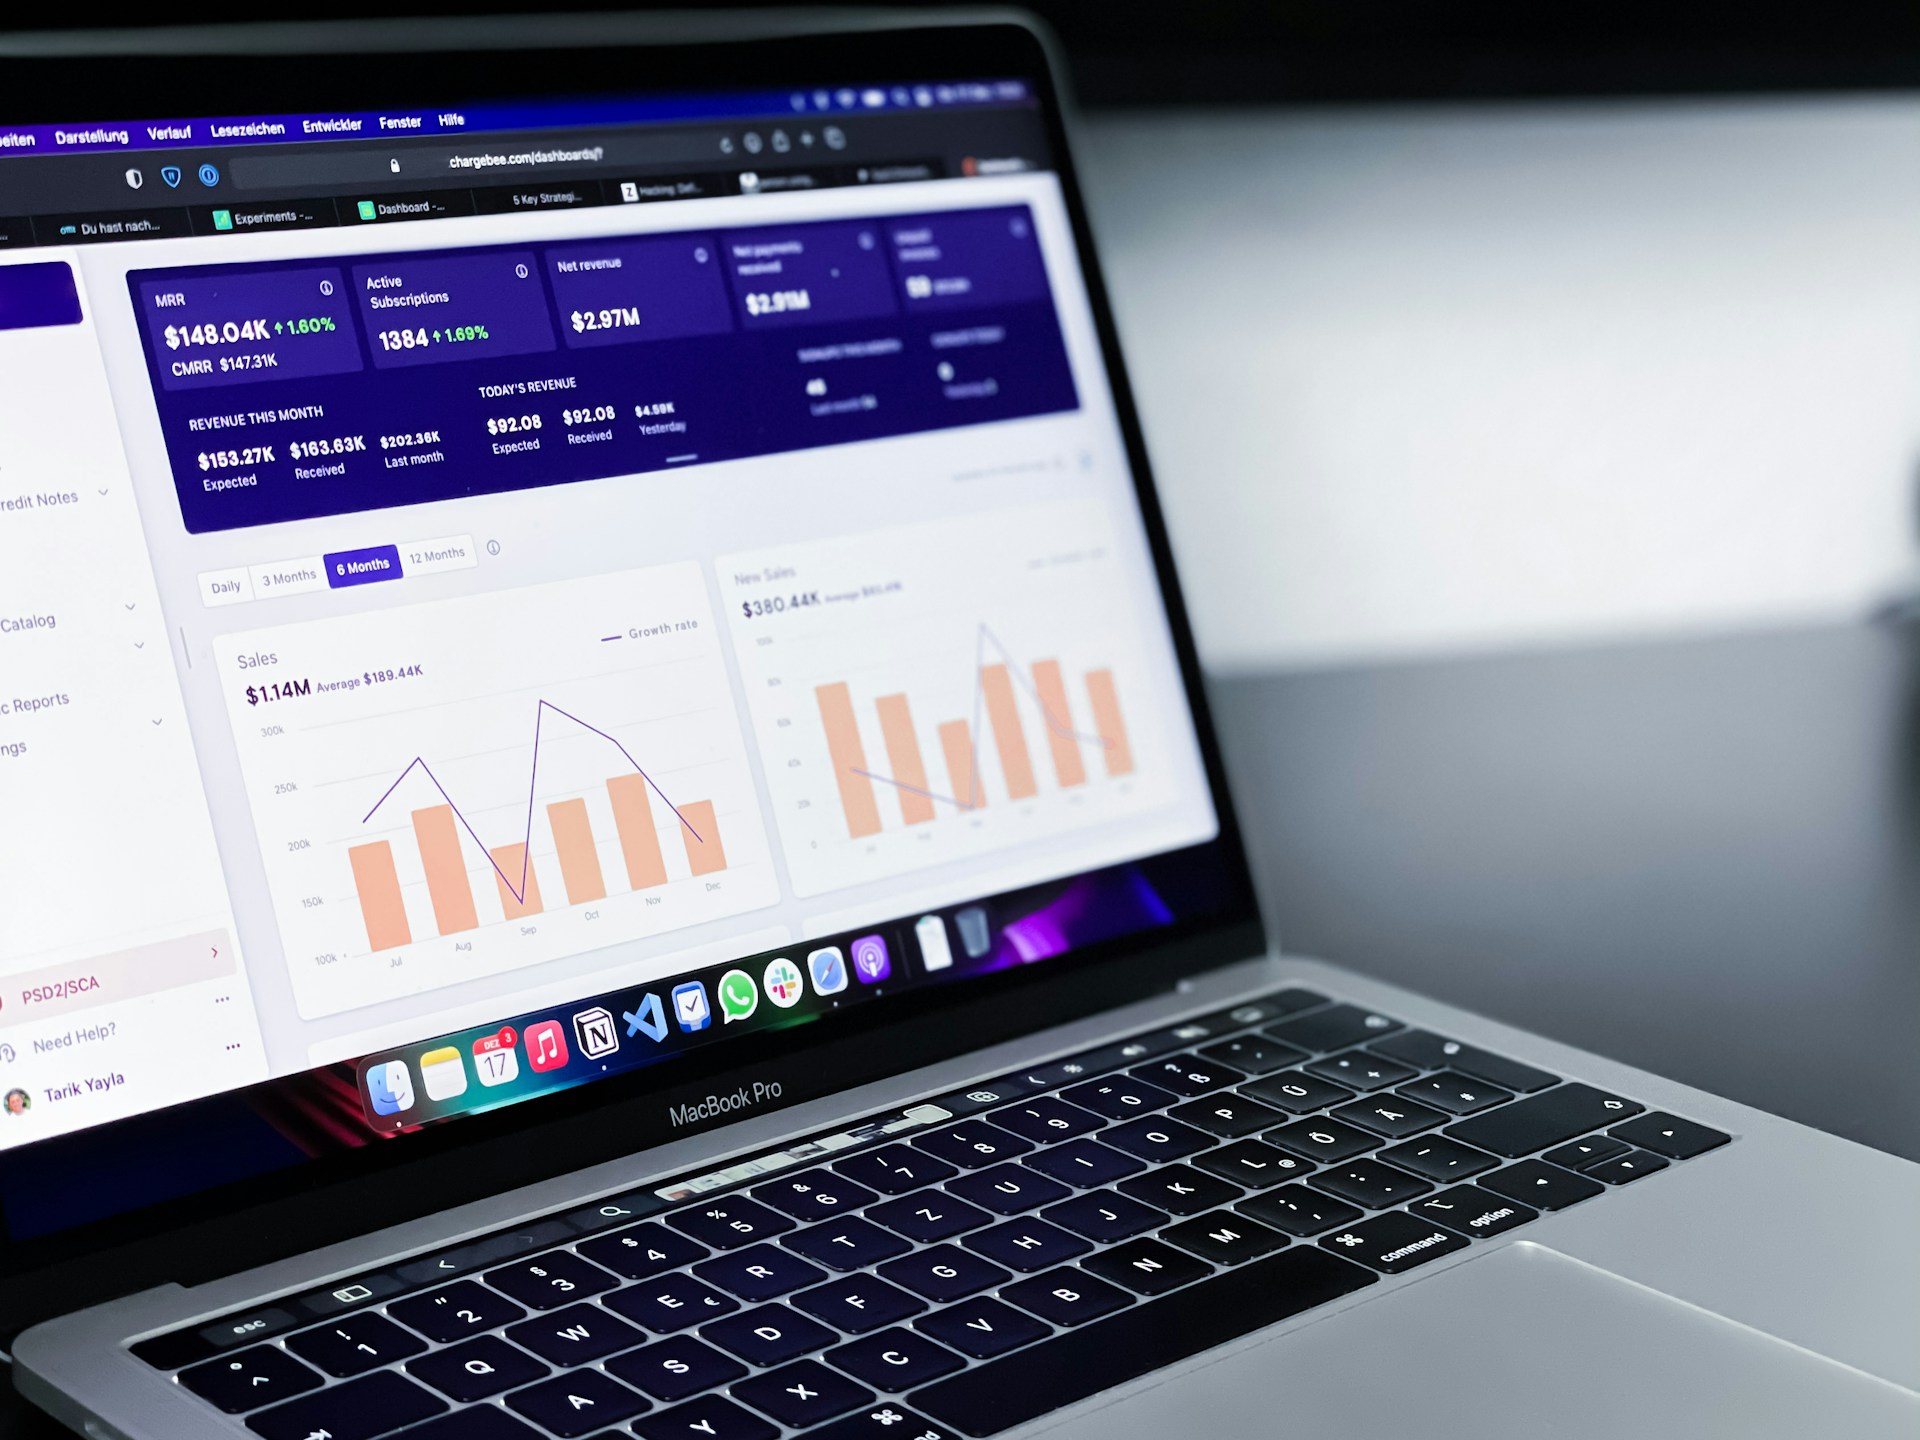
Learn to utilize powerful data visualization tools like Power BI and Tableau for insightful reporting.

A computer screen displaying a data analytics dashboard with graphs and charts. A blue line graph shows fluctuations in data over time, and a section highlights the number of page views. A pie chart is partially visible, indicating a breakdown of different data elements.
ETL Solutions

Discover efficient ETL solutions using SSIS to streamline your data integration and transformation processes.

Comprehensive Reporting Services

Master comprehensive reporting services with SSRS and Power BI Report Builder for impactful insights.
A computer screen displaying analytics dashboards with various charts, including a line graph on the left and a cohort analysis table on the right. The table is populated with different shades of blue, indicating varying levels of user activity over several weeks. Text labels and numbers detail user retention statistics.
A digital screen displaying analytical data with line graphs, histograms, and numerical values. The data is presented in a user-friendly interface with different shades of blue used to distinguish various elements.

Contact Us

An abstract, pastel-colored, 3D-rendered representation of data analysis and search engine optimization (SEO). The image features a computer interface with various analytics symbols, including a magnifying glass, bar charts, pie charts, and a search bar with the text 'SEO'. Surrounding the interface are different objects such as a potted plant, a cup with a saucer, and a megaphone, all placed on a light green background.

Reach out for inquiries about business intelligence tools like Power BI, SSRS, and Azure Synapse.